One item I have not heard yet on the news.
The insurance industry is caught in an interesting situation. They are well aware that one of the largest consequences of climate change is an increased frequency of more intense storms. This has a very direct consequence for their projected losses in any given season. Most of them have realized that their actuarial models based on historical storm frequencies are not the state-of-the-art anymore, and they have spent a great deal of money on computer models that match storm predictions to real estate and infrastructure inventories in order to understand what the consequences of a storm season might be.
However, the law constrains them to base their premium rates on historical records. They will therefore always be behind the curve, and they know that there will be little goodwill from a public that perceives them with suspicion. After all, who has the money to put up the largest building in just about every city?
$25 billion of damage and counting.
An interesting simulation of flooding done by NASA using Shuttle Radar Topography data: Quicktime, 6Mb. Current flooding is between the 3 and 4 meter marks.
Wednesday, August 31, 2005

Friday, August 26, 2005
Jumpy little fella:
Back in April I posted a note about the preparation for the Shuttle launch, and how two WB-57 chase planes were being modified to do HDTV footage of the launch. Here is the HDTV turret assembly mounted on the WB:
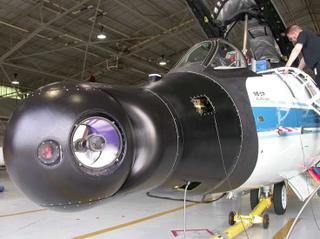
Here is the video from the STS-114 WAVE mission (WMV format). You be the judge - did it turn out well? Can you see why the NASA PR office has not used this as I thought they might?
Here is a photo taken with a hand-held camera from the cockpit of the WB-57 taken during a launch (not STS-114). You can barely see the plume from the SRBs (click on the image to get a much larger version, 1200x1600) :

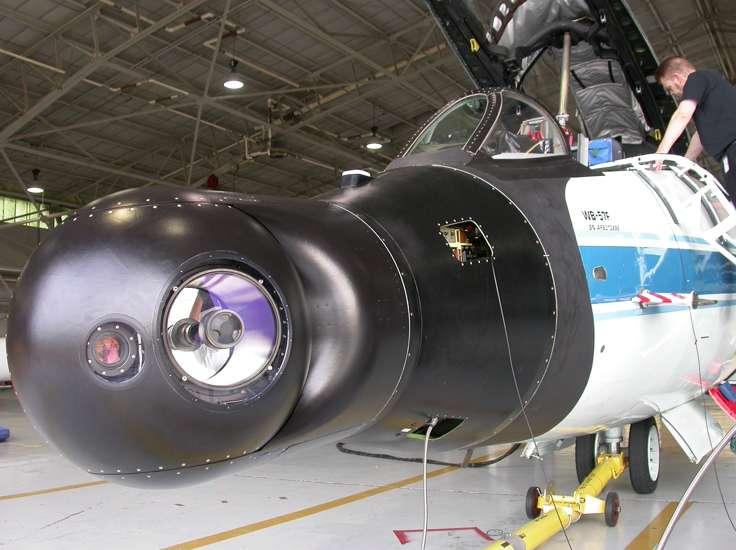
Here is the video from the STS-114 WAVE mission (WMV format). You be the judge - did it turn out well? Can you see why the NASA PR office has not used this as I thought they might?
Here is a photo taken with a hand-held camera from the cockpit of the WB-57 taken during a launch (not STS-114). You can barely see the plume from the SRBs (click on the image to get a much larger version, 1200x1600) :

Wednesday, August 24, 2005
Nice day for a touch of cocolitzli, eh?:
At a recent meeting about drilling to look at long-term records of climate change, one of the participants brought up Bill Ruddiman's theory about the onset of recent climate change, and that made me think of some interesting connections.
Bill observed that CO2 and methane in the atmosphere regularly follow cycles that are driven by orbital changes, but that in the recent past, they deviated, rising in concentration when they should have fallen. The CO2 begins to rise about 8,000 years ago, and methane begins to rise about 5,000 years ago (New Scientist article, graphs). That is a lot sooner than can be attributed to industrialization (post 1700's), and Bill proposed that this was due to a major change in the land cover - the rise of human agriculture and the removal of forests.
A piece of this article also deals with the "Little Ice Age," a period during the Middle Ages when temperatures were lower than normal, and the winters were particularly hard in Europe. Rather than having the Little Ice Age exacerbate the effects of the Black Plague as is usually taught, Bill turned this on its head, and wondered whether in fact the arrival of the plague that killed off about 50% of the human population meant that all that land that went fallow in fact began absorbing CO2 as the forests regrew, and that this drop in CO2 caused the low temperatures.
So I immediately began to wonder whether in fact this was linked to the arrival of Europeans in the Americas, and the great changes in population that occurred here with the spread of disease. In Mexico, probably the most populous and highly organized society, the outbreaks of cocolitzli in 1545 wiped out about 90% of the population, and the 1576 episode then wiped out 50% of those remaining. This had to have had a large effect on the amount of land under agriculture, and thereby on the land cover.
I then went forward in time, and wondered if the cure for all this global warming that is going on would be a pandemic of H5N1 avian flu. If the published survival rate of 45% for this strain is combined with a global outbreak, it would have an enormous impact on humans, and therefore on land cover, and from there, on climate. (Avian flu timeline)
Mind you, there was a fair bit of criticism of the idea of the plague causing the LIA in the paleoclimate community. For one, when we look at marine records preserving many hundreds of thousands of years of sediments, there are fairly regular millenial cycles in the sediments that are probably caused by variations in temperature. Bill's theory does not explain this cyclicity - no evidence has been found for a parallel cyclicity for land cover, much less disease.
Could it happen this time? Of course. Is disease among humans what caused the Little Ice Age? Not clear. Is disease among humans and animals what usually causes these changes in climate? Probably not.
Bill observed that CO2 and methane in the atmosphere regularly follow cycles that are driven by orbital changes, but that in the recent past, they deviated, rising in concentration when they should have fallen. The CO2 begins to rise about 8,000 years ago, and methane begins to rise about 5,000 years ago (New Scientist article, graphs). That is a lot sooner than can be attributed to industrialization (post 1700's), and Bill proposed that this was due to a major change in the land cover - the rise of human agriculture and the removal of forests.
A piece of this article also deals with the "Little Ice Age," a period during the Middle Ages when temperatures were lower than normal, and the winters were particularly hard in Europe. Rather than having the Little Ice Age exacerbate the effects of the Black Plague as is usually taught, Bill turned this on its head, and wondered whether in fact the arrival of the plague that killed off about 50% of the human population meant that all that land that went fallow in fact began absorbing CO2 as the forests regrew, and that this drop in CO2 caused the low temperatures.
So I immediately began to wonder whether in fact this was linked to the arrival of Europeans in the Americas, and the great changes in population that occurred here with the spread of disease. In Mexico, probably the most populous and highly organized society, the outbreaks of cocolitzli in 1545 wiped out about 90% of the population, and the 1576 episode then wiped out 50% of those remaining. This had to have had a large effect on the amount of land under agriculture, and thereby on the land cover.
I then went forward in time, and wondered if the cure for all this global warming that is going on would be a pandemic of H5N1 avian flu. If the published survival rate of 45% for this strain is combined with a global outbreak, it would have an enormous impact on humans, and therefore on land cover, and from there, on climate. (Avian flu timeline)
Mind you, there was a fair bit of criticism of the idea of the plague causing the LIA in the paleoclimate community. For one, when we look at marine records preserving many hundreds of thousands of years of sediments, there are fairly regular millenial cycles in the sediments that are probably caused by variations in temperature. Bill's theory does not explain this cyclicity - no evidence has been found for a parallel cyclicity for land cover, much less disease.
Could it happen this time? Of course. Is disease among humans what caused the Little Ice Age? Not clear. Is disease among humans and animals what usually causes these changes in climate? Probably not.
Tuesday, August 23, 2005
OS XS:
OK, I admit it, it was just a bit of "can it be done?"
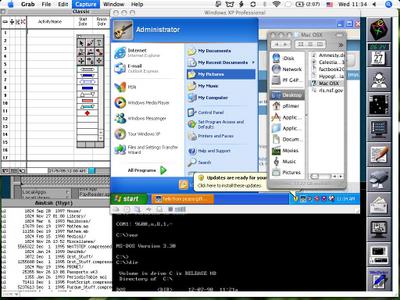

There's a bit of a cheat here - the NeXT and its embedded emulations are not actually running at the same time as the OSX and the WinXP, but I thought it would look interesting. Now to get some BeOS and other X-flavor screen shots in there as well...
Wednesday, August 10, 2005
Falcon web-cam:
I spotted this little fellow today on the Panama Canal web-cam at the Miraflores Locks.

Peregrine web-cam!
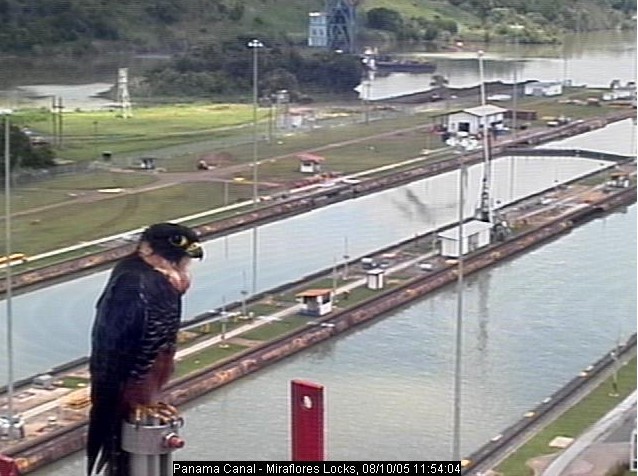
Peregrine web-cam!

Looks like a peregrine falcon to me...
I happened to spot it by using the SlothCam widget on my desktop, which cycles through a set of web-cams. The list supplied by default with the widget and on the website is pretty limited - I would like to eventually find a better set...
Tuesday, August 09, 2005
Down:
Discovery is puffing away on the runway out at Edwards AFB.
Here's a shot of the shuttle aproaching through an infra-red spotting scope:
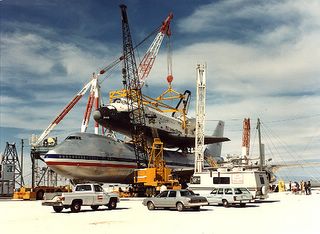
Columbia being mated to the SCA (NASA photo)
Here's a shot of the shuttle aproaching through an infra-red spotting scope:
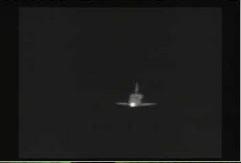
From the brightness in the image, you can clearly see that the nose bears the brunt of the re-entry heating.
Good thing they didn't have to go to the White Sands landing strip - the gypsum out there really gummed up the brakes on STS-3 in 1982, the last time that site was used.
It will of course have to be flown back to Florida aboard the specially modified 747, the Shuttle Carrier Aircraft, or SCA, shown here being mated with the Shuttle at White Sands after the STS-3 mission:
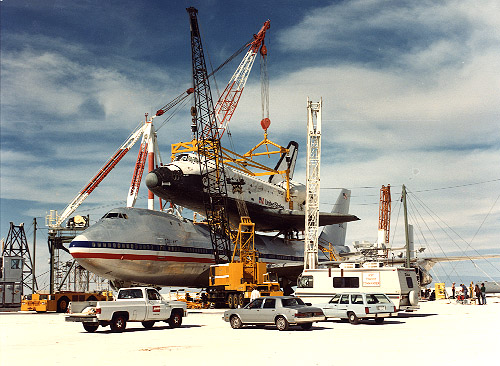
Columbia being mated to the SCA (NASA photo)
and yes, those are American Airlines' colors - not sure why they are still on there, but I remember hearing this from the pilot's son, Doug Trott, with whom I went to school in the late 1970's.
- posted using a Widget!
Tuesday, July 26, 2005
Return to Flight:
Much anxiety surrounded the return to space for the Shuttle today. I watched the launch on a Mac desktop widget linked to the KSC NASA TV transmission over a wireless connection while sitting in a meeting at the Brazilian Space Research Institute, INPE. Of course the NASA TV server was getting hammered pretty hard, so I only got a screen refresh every minute or so. But it was enough to do a series of frame grabs, and see the view from the camera placed on the External Tank (ET). Despite the stuttering video, an impressive display of what today's communications technology can do.
The sequence I was able to capture shows the changes in vehicle attitude throughout the ascent quite nicely. There was no on-screen countdown, so I am not sure exactly where in the sequence these scenes occur, but a lot can be deduced from what is in sight, what angles they appear at, sun angle, etc.
The first two shots are simply the required shot of the shuttle just after clearing the gantry on LC-39B, and a view from one of the off-track spotting scopes (which gives you an idea of the poor visual resolution we generally have of launches) ...

Sequence 1

Sequence 2
Sequence 3
Sequence 4
Sequence 5
Sequence 6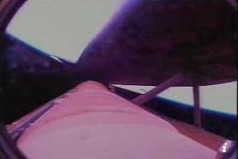
Sequence 7
Sequence 8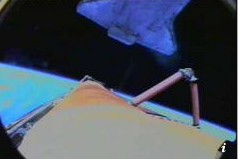
Sequence 9
Sequence 10
The sequence I was able to capture shows the changes in vehicle attitude throughout the ascent quite nicely. There was no on-screen countdown, so I am not sure exactly where in the sequence these scenes occur, but a lot can be deduced from what is in sight, what angles they appear at, sun angle, etc.
The first two shots are simply the required shot of the shuttle just after clearing the gantry on LC-39B, and a view from one of the off-track spotting scopes (which gives you an idea of the poor visual resolution we generally have of launches) ...
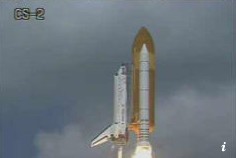
Sequence 1
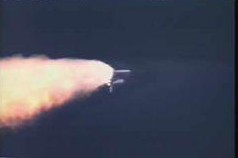
Sequence 2
Now to the feedline fairing camera on the ET, which gives a very nice view of the underside of the orbiter, the ET and right SRB. At his point in the ascent, there are several things to note in the scene: the Florida shoreline is just above the elevon line, reflecting the shuttle-down attitude used on ascent. The SRB exhaust flames are visible, as are their reflections off the aft tile acreage.
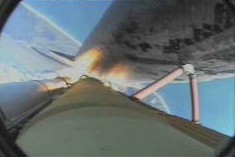
Sequence 3
In this next scene, the main change is the ascent attitude, with the shoreline creeping up the tail, as the shuttle's velocity vector slowly shifts from vertical to horizontal, in order to give it enough speed to achieve orbit. That may be a glimpse of LC-39A or B visible between the bipod:
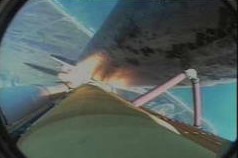
Sequence 4
In this next scene, the main change in the sun angle, which is causing saturation of the image.
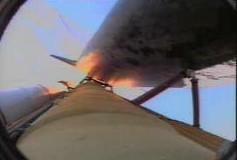
Sequence 5
In this next scene several things have already happened: the SRBs have already separated (so we are beyond 127 seconds into the mission), and the horizon is in view. The shuttle is now using the main engines to stabilize and circularize its orbit, probably over Europe and Northern Asia by this point. This is more or less the time when the largest piece of foam was seen drifting off. There was more lost at various points in the ascent, some earlier, some later.
The largest piece, about 3 feet by 1 foot, came off the LH2 Protuberance Air Load Ramp, which is just outboard of the piping and ducting that can be seen on the left running along the ET. This apparently occurred about 127 secs into mission, which is coincident with the SRB jettison. I have not heard any analysis of this yet (an interesting read is the Return To Flight Task Force Report, large PDF).

Sequence 6
As the nose dips toward the horizon, the tail comes up...
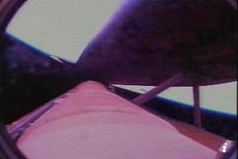
Sequence 7
Big attitudinal changes now - The shuttle has executed a roll, so the Earth is below the belly now, rather than above.
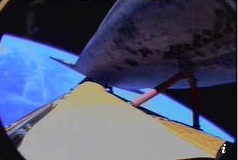
Sequence 8
And finally, ... jettisoning of the ET. In comparison with the previous scene, we can see that the orbiter is actually the part that has changed attitude most - the horizon has not moved much from the ET's point of view. Nice view of the orbiter underbelly, I wish I had been able to see more of this. NASA does not have any of this footage easily available.

Sequence 9
...and now, a view from the orbiter of the ET.

Sequence 10
Here is a gallery of photos of the ET from this flight, including some nice close-ups of the foam loss locations. Here's some video of the ET from previous missions.
I did find a link to footage from a camera in the SRBs on this launch - several things to note: just before SRB separation, you can see pitting occur in the ET insulation; after the separation, the opposing SRB is visible tumbling at almost the same rate - it stays at a constant angle in the field of view; nice views of the Florida coast, and all the way to splashdown. Mac-hostile links: Left SRB footage. Right SRB footage.
Wednesday, July 20, 2005
Dia de la Independencia:
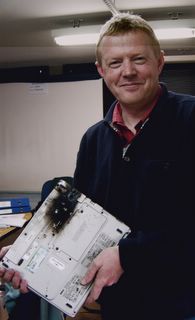
The fireworks on this independence day were particularly smelly. The Dell laptop we were using in a meeting emitted a loud 'pop' and then burst into flames. We quickly extinguished it, but the room was full of congealed plastic smoke bits floating all about.
fireworks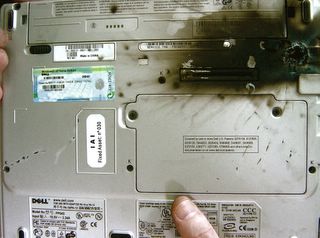
Veinte de julio

fireworks
Caused quite a stir - the flames were about half-way up the screen, and left a nice burn mark on the desk. Pity I didn't have the camera at the ready for that part - I was only able to capture the aftermath.

Veinte de julio
Dell was very good about it. After seeing the photo, they agreed to ship a replacement immediately. Of course, 'immediately' has another meaning here. I'm in Brazil this week, where 'immediately' is pronounced 'soon,' and is understood as 'sometime.'
Thursday, July 07, 2005
L. Patrick Gray III:
Pat Gray died yesterday.
He was best known to the world as the successor to J. Edgar Hoover as the Acting Director of the FBI, and for his role in the Watergate scandal, which occurred during his confirmation hearing in the Senate Committee on the Judiciary in February-March of 1973 (Time magazine archive). He was ultimately pilloried. Lately, he was again in the news because 'Deep Throat' was his deputy, W. Mark Felt.
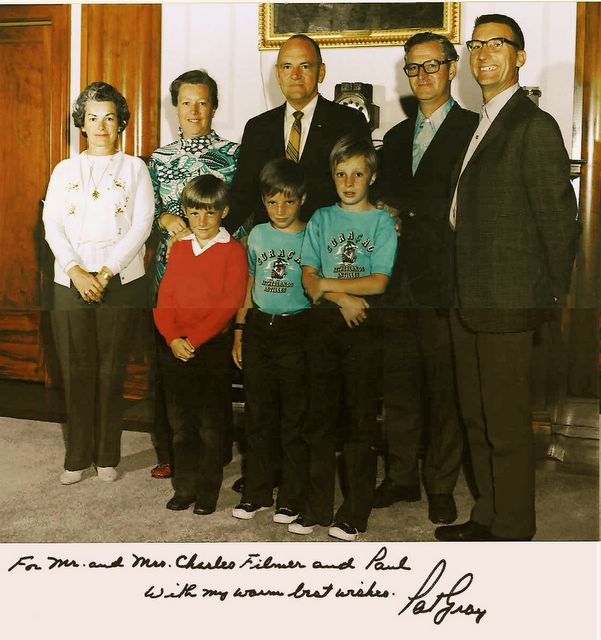
However, I remember him more for taking me down into the shooting range at the FBI building, and then giving me the target silhouette full of bullet holes. Now that was interesting to a nine-year old. Never mind all this political stuff going on... I didn't realize that I had just met a lot of folks who were about to have an annus horribilis: Rosemary Woods, Ron Ziegler, David Gergen...
Visit to FBI
He was best known to the world as the successor to J. Edgar Hoover as the Acting Director of the FBI, and for his role in the Watergate scandal, which occurred during his confirmation hearing in the Senate Committee on the Judiciary in February-March of 1973 (Time magazine archive). He was ultimately pilloried. Lately, he was again in the news because 'Deep Throat' was his deputy, W. Mark Felt.
However, I remember him more for taking me down into the shooting range at the FBI building, and then giving me the target silhouette full of bullet holes. Now that was interesting to a nine-year old. Never mind all this political stuff going on... I didn't realize that I had just met a lot of folks who were about to have an annus horribilis: Rosemary Woods, Ron Ziegler, David Gergen...
Visit to FBI
I'm the little monkey in the red sweater.
Monday, July 04, 2005
F. S. K.:
If you haven't noticed yet, most of the titles to my posts are unexplained riddles. If you are an American, you should be able to get this one. If you are not, then you may have trouble.

July 4
July 4
Sunday, June 19, 2005
THE Photoshop:
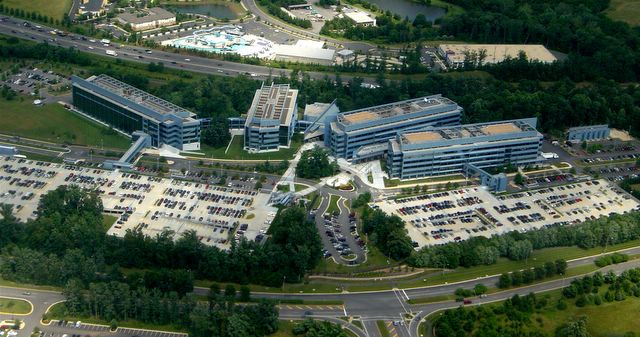
NRO
One of the first tests for getting a job in the "IC" must be navigating their (necessarily) turgid websites... the NSA's job posting site is particularly cryptic (no pun intended).
Despite their web-monkeys' well-constrained attempts, there is obviously a lot of good 'product' here. The most popular open one being the CIA World Factbook 2005 (32.9Mb zip file)
Not much of a post, I know. But the aerial shot was fun.
Saturday, June 18, 2005
NVidia RAGE Climate modeling:
I spotted this news item today:
Computer Graphics Card Simulates Supernova Collapse
New Scientist (06/10/05)
Researchers at the Los Alamos National Laboratory (LANL) in California have developed a programming language called Scout that enables complex mathematical calculations to be run on a computer's graphics processing unit rather than its central processing unit (CPU). (full article)
Several thoughts:
First, interesting that a segment of the market aimed at entertainment is driving chip performance, production and design so hard that it would approach that needed for computation-intensive science. This is in the same vein as a previous post of mine, speculating that the need for accurate spam filtering software may drive the language recognition programming field harder than any other factor.
Second, it's rather interesting to realize that first-world youth probably has an enormous amount of computing power at its disposal. I note in the article that they are working on a version of the programming language that will allow networked computers to share their graphics cards computing power, sort of like the SETI@Home model.
Third, it occurs to me that this must be giving the export control folks a fit. Will high-powered graphics card access software be a 'deemed export'? We shall see.
Computer Graphics Card Simulates Supernova Collapse
New Scientist (06/10/05)
Researchers at the Los Alamos National Laboratory (LANL) in California have developed a programming language called Scout that enables complex mathematical calculations to be run on a computer's graphics processing unit rather than its central processing unit (CPU). (full article)
Several thoughts:
First, interesting that a segment of the market aimed at entertainment is driving chip performance, production and design so hard that it would approach that needed for computation-intensive science. This is in the same vein as a previous post of mine, speculating that the need for accurate spam filtering software may drive the language recognition programming field harder than any other factor.
Second, it's rather interesting to realize that first-world youth probably has an enormous amount of computing power at its disposal. I note in the article that they are working on a version of the programming language that will allow networked computers to share their graphics cards computing power, sort of like the SETI@Home model.
Third, it occurs to me that this must be giving the export control folks a fit. Will high-powered graphics card access software be a 'deemed export'? We shall see.
Friday, June 17, 2005
Mariners, Waves, & Tsunamis:
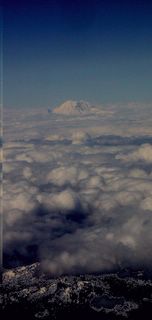
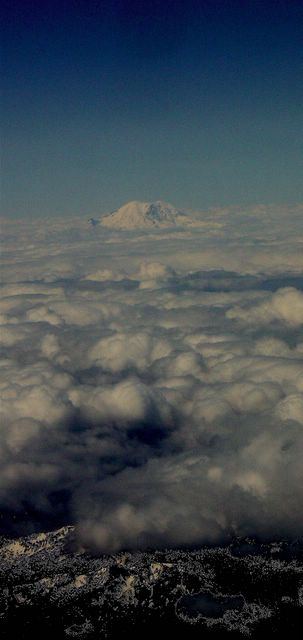
Before I descended below the cloud deck and into the hubbub of this week's meeting in Seattle, I was able to catch a nice glimpse of Mt. Rainier:
Rainier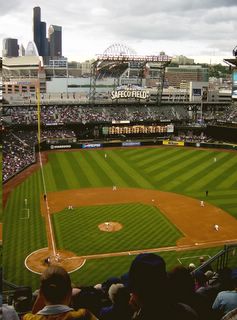
Safeco Field
Scoreboard acknowledgment
Seattle night stadium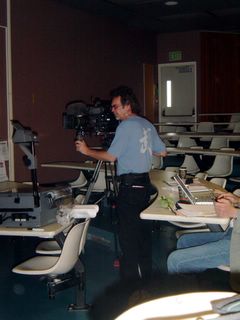
NBC News Crew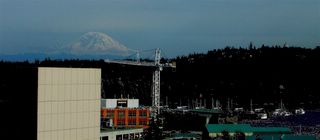
Husky Office view
Rainier
The meeting iwas to look at what the deposits left by a tsunami can tell us about the event itself.
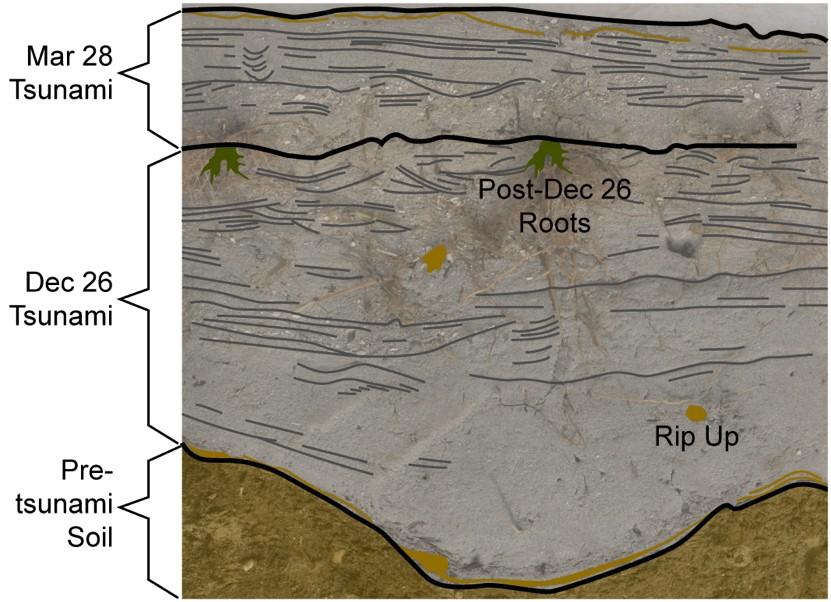
A friend to whom I mentioned this said Tsunami deposits? You mean, like, 'bodies and hotel furniture?' Umm, well, no - the deposits are mostly rocks, sand and mud. The basic question is what can the deposits tell us about the frequency of these events, and about the tsunami's speed, direction, evolution, and maybe even what caused it. As my friend well knew, these deposits are laid down in many areas that did not have resorts.
Here's a tsunami deposit, from a beach in Indonesia hit by both the December 2004 and March 2005 events. The photo was taken by one of the International Tsunami Survey teams, and given to me by Lori Dengler:
The hope is tha by looking at grain sizes, distributions, mineralogy, etc. that we might even be able to date and locate sources of tsunamis in order to get a better handle on local frequencies for these types of events.
The group meeting here is a sampling of the world's expert sedimentologists, geologists, geophysicists, hydrodynamicists, numerical modelers, database experts, etc. etc.
As part of the social events, many of us went to a Seattle Mariners baseball game on the evening of June 14 at Safeco Field (and this really does have to do with the topic...):

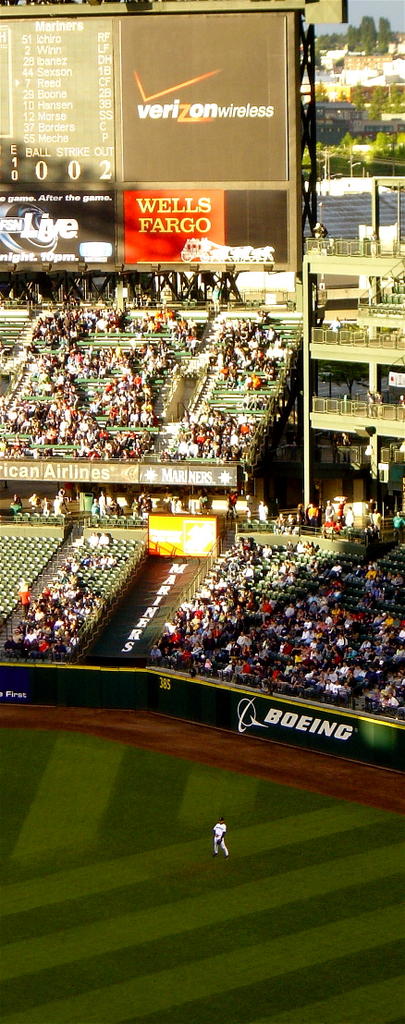
Safeco Field
For our Japanese participants, the highlight of the game was when we saw Seattle's Ichiro hit his 1000th base hit, and of course to see him in right field: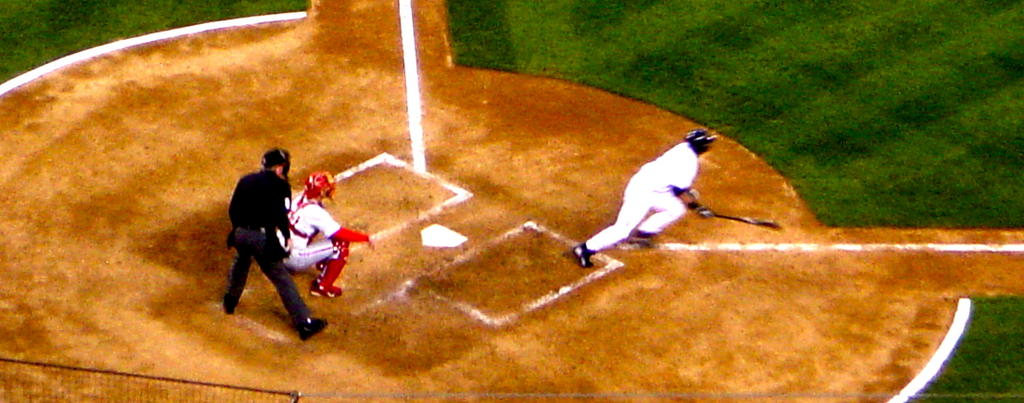
It was also nice to be electronically welcomed to the stadium - although any fans paying attention to the scoreboard were probably also confused as to what, exactly, tsunami deposits were:
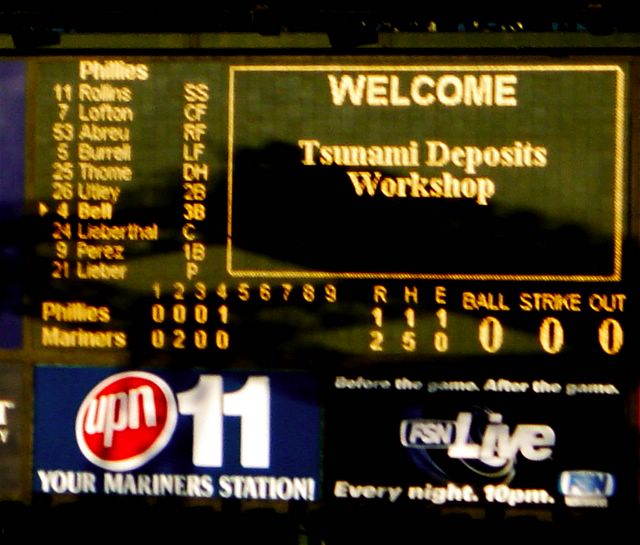
Scoreboard acknowledgment
Well, during the latter part of the game, all of the sudden our group's cell phones went off like crazy. A large-ish earthquake had just occurred off the coast of Oregon, triggering a tsunami warning along the Western coasts of the U.S. and Canada. And, of course, the world's top tsunami specialists were all sitting at Safeco Field in Seattle, drinking beer.
We got the details from the callers (including some family members in Oregon who were being directly affected), had a quick discussion, decided the tsunami risk to the West coasts was minimal, and returned to drinking beer, talking to friends, and oh yes, occasionally watching baseball like the rest of the crowd. Why minimal? Because this was an earthquake in the middle of the Gorda plate, and was therefore very likely strike-slip rather than a thrust event - which meant that the amount of motion on the seafloor that displaced water was probably very small. This meant that the resulting tsunami would be very small (and in fact 20 minutes later, when the tsunami arrived, the tide gauges at Cresecnt City and Eureka measured less than one inch). Here's the location of the earthquake: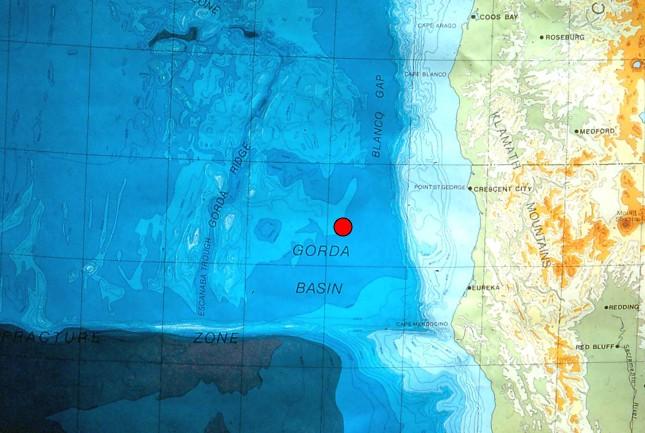
However, the lesson here is not one of complacency - there is a lot of evidence showing that the Pacific Northwest has been hit many times by tsunamis at least as big as the 2004 Indian Ocean event. And, like Indonesia, Washington and Oregon States will bear the brunt of the waves, with little to no time for evacuation. Here are maps showing the tsunami-genic Sunda and Cascadia subduction zones off Sumatra and the U.S.-Canadian West:
We left that game a fair bit later (Seattle won over the Phillies), and contemplated the brooding stadium next door in a strange evening light. Conversation ensued about how a city could get itself into such a political tangle that it accepted the building of two stadiums where one would have sufficed. Since I am from Washington DC, I kept my mouth shut.

Seattle night stadium
Sure enough, the next morning the meeting was crawling with news media looking for the experts. This is the NBC Evening News crew's cameraman, filming one of the speakers:
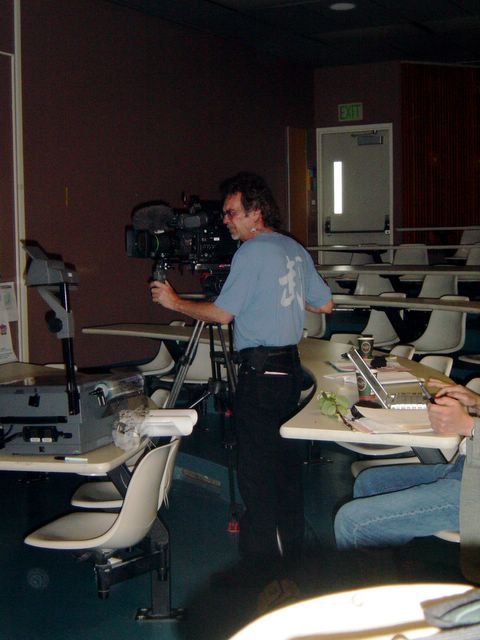
NBC News Crew
The result: some good pieces in the print media, and about ten seconds on the national news. Not bad, especially considering that the local authorities in Oregon got creamed for a failed radio alert network, and not being able to control the curious public who went down to the beach to watch for a tsunami.
The result from the workshop? A lot can be learned locally about effects and history of tsunamis, but the records are so heterogeneous and dispersed (especially the paleorecords) that putting together a picture of the source mechanism is proabably beyond our reach. Even in the best possible conditions, there is little chance of reconstructing the event itself. Even knowing the date and location of the events in December and March in the Indian Ocean, we would probably not be able to distinguish two separate events in the deposits a few years later, so the distinction in the photos at the top of this post would disappear. In addition, we know the topography enough to model wave run-up on land, and we know the deep-sea bathymetry well enough to model tsunami propagation, but we do not know the near shore bathymetry well at all - and that is critical for matching the models of deep-sea wave propagation with the on-shore run-up.
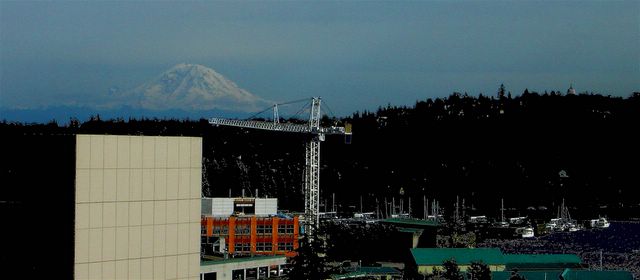
And Seattle? Seattle was left peacefully as before, waiting patiently to be swept away by a tsunami or buried in volcanic ash. An idyllic view from office windows at the University of Washington.
Husky Office view
Subscribe to:
Posts (Atom)