An old MIT friend now directs a program that takes Doppler radars into as direct a line with trouble as possible. Josh Wurman and his team recorded the highest near-surface windspeed ever, 301 mph in a tornado with equipment like this. 

This is a MODIS shot of Frances, just off the northern shore of the Caribbean island of Hispaniola. Frances is in the middle of destroying the Haitian city of Gonaives - relentless denudation of the hillslopes for firewood above the city left no barriers to stop the topsoil from being washed away into torrents of mud.

Just as the sun sets or rises, one can often see the shadow of the Earth rise or set in the opposite direction. The effect lasts only a couple of minutes. In this photo, taken at about 35,000 feet over the Turks & Caicos, the sun is rising to the right, and the shadow is setting to the left. The sharp purple shadow of the curve of the Earth lasted only a minute or so. This is the only "terminator" you will see. 


Well, the moniker "Ivan the Terrible" was fairly predictable. I hope we don't get to "Vlad the Impaler" for two reasons: first, the imagery of something worse than Ivan is hard to imagine, and second, the name Vlad would mean that we would have had twenty-two named storms!
Here's an updated set of my favourite hurricane links:
I also found two really nice movies by NASA Goddard showing how hurricanes feed off warm water. You will need a fairly robust connection to download these quickly, so beware if you are on dial-up... The first example shows hurricanes Fabian and Isabel (1Mb MPEG-1) moving across the Atlantic and Caribbean in 2003. The color represents sea-surface temperature, with blue colder than orange. Note how the passing of the hurricanes leaves a cold wake as the hurricanes feed off the warm waters.
The second example shows an interaction between tracks, as the 1998 hurricanes Bonnie and Danielle (6Mb QuickTime) interfere with one another - if you watch carefully, you can see that Danielle is weakened as she passes over water that has been cooled already by Bonnie (it's harder to see, but if you go back to the first movie, you will see that Isabel is not weakened much by crossing Fabian's track because enough time had passed that the track had mixed and warmed up again).
This is also why hurricanes weaken as they approach land - there is simply not enough water volume to feed them as the shallowing waters begin to starve them even before they make landfall. You can deduce from this that an approach path over a broad shallow shelf will weaken an storm more than an approach over a narrow steep shelf. Even then, if a warm current flows near-shore, it can strengthen a storm - something that is expected to occur for Ivan.

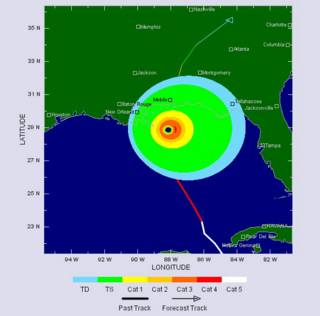
Forecast position and windfield for 36 hours from now.
Here's a quick set of my best places to go:
Hope this helps!


I knew that in the end, the proteins that make up the organelles, walls, and other structures in cells and viruses had to have a physical movement involved when they changed conformations. What I wasn't prepared for was how darned mechanical those motions might appear in some cases.
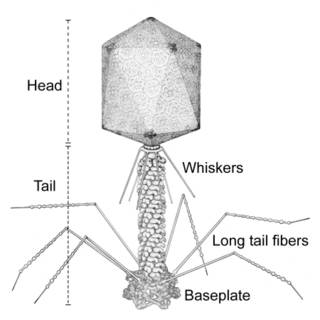
Recent work by a group from Purdue University and the Shemyachin-Ovchinnikov Institute combined data from many X-ray crytallography and cryo-electron microscopy experiments to get a step-by-step picture of how a T4 phage (virus) infects an E. coli bacteria. This combination of data allowed the group to make a simulated video of the protein conformational changes as the phage attacks a bacterium.
?The video (large 20.7MB Quicktime, small Quicktime, large MP4, small MP4, large DivX) is quite amazing - watch for the unfolding short tail fibers, the simultaneous change in the baseplate (the kernel of the Purdue/Shemyachin-Ovchinnikov group's work), and then the eerie coiling of the tail sheath proteins. It's very gear-like as the tail tube drills through the cell wall. The deposited lysozyme (in green) then digests the peptidoglycan (in blue) and the tube can then inject the viral DNA into the bacterium.
I wonder how much of this is from actual data, how much is from animation texture mapping, and how much is "in-betweening."
The long-term driver behind this research is not only to study how T4 attacks E. coli, but to understand how each of the proteins contributes to the activity, possibly modify some of them so that T4 can attack other pathogens, and in the very long run, learn how to make nano-machines that can carry out particular actions (contract, drill, rotate, etc.)
Hang on - I have a tingle in my nose.... perhaps H7N2 avian flu?